https://doi.org/10.59793/ijcp.v34i2.454
Abstract
Background: Constipation is a common gastrointestinal problem in the general population. Despite a plethora of well-established and safe treatment options, the improvement is not satisfactory for many patients. This has prompted interest in alternative therapeutic strategies for constipation. Methods: This open-label, non-comparative single-arm clinical study evaluated the efficacy and safety of the polyherbal formulation “Anuloma DS”, 1 tablet daily at bedtime, in improving bowel movements in 30 adult patients with functional constipation. Patients were evaluated at baseline (Visit 1, Day 0) and follow-ups during Visit 2 (Day 7 ± 2), Visit 3 (Day 14 ± 2) and Visit 4 (End of the Study) at Day 30 ± 2. Results: There was a significant increase in the mean of spontaneous bowel movement every week from day 7 to days 14 and 30. All constipation symptoms such as abdominal bloating (aadmana), abdominal pain/discomfort (aanaha), feeling of incomplete evacuation and straining during passing stool improved significantly as did the SGA and the PGA scores. Conclusion: Anuloma DS is highly effective for the treatment of chronic functional constipation. No treatment-related side effects were reported by the study participants.
Keywords: Chronic functional constipation, polyherbal, spontaneous bowel movement, SGA score, PGA score
Constipation is a common gastrointestinal problem in the general population, as well as in patients with various disorders, with an overall global prevalence of 12% to 19%.1 Various drugs such as bulking agents, stimulants, stool softeners and osmotic agents are used in clinical practice.2,3 Conventional treatment of constipation is well-established and safe, but it does not provide satisfactory improvement for many patients, prompting interest in alternative therapeutic strategies4 as possible solutions to the problem of constipation. The formulation used in this study, i.e., "Anuloma DS", is an Ayurvedic proprietary medicine that contains different medicinal plants such as Cassia lanceolata (Senna), Apium leptophyllum (Ajmoda), Cuminum cyminum (Cumin), Terminalia chebula (Haritaki), Glycyrrhiza glabra (Liquorice), Zingiber officinale (Ginger) and Halite (Rock salt). A study was conducted with the aim to evaluate the efficacy and safety of "Anuloma DS" tablets in persons suffering from functional constipation.
METHODS
The primary objective of the study was to evaluate the efficacy of “Anuloma DS” tablet in improving bowel movements in adult patients with constipation. Evaluation of the safety and tolerability of “Anuloma DS” tablet was the secondary objective of the study.
The study designed as an open-label, non-comparative single-arm clinical study enrolled subjects visiting OPDs for the treatment of improper bowel movements. After baseline assessment at visit 1, eligible subjects were instructed to take Anuloma DS 1 tablet per day at bedtime for a period of 30 days. Written informed consent was obtained from all participants on day 0.
The study was carried out according to the Declaration of Helsinki, Indian Council of Medical Research (ICMR) ethical guidelines for biomedical research and International Conference on Harmonization (ICH) guidelines for Good Clinical Practice (GCP).
The inclusion criteria were male and female adults, aged 18 to 65 years, suffering from chronic constipation and subjects who were willing to sign consent forms and were able to present for follow-ups. Chronic functional constipation was diagnosed based on the presence of 2 or more of the following symptoms, for at least 12 weeks in the preceding year.
- Straining with >25% of bowel movements.
- Sense of incomplete evacuation with >25% of bowel movements.
- Hard or pellet-like stools with >25% of bowel movements.
- Manual evaluation maneuvers with >25% of bowel movements.
- Feeling of anorectal blockage with >25% of bowel movements.
- Number of bowel movements 2 or less per week.
The exclusion criteria were pregnant women or women child-bearing potential who were likely to become pregnant, patients with history of mechanical obstruction, mega colon/mega rectum or a diagnosis of pseudo-obstruction or hospitalization for any gastrointestinal or abdominal surgical procedure during the 3 months before the start of the study. Participants with clinically significant cardiovascular, liver, lung or other systemic disease; neurologic or psychiatric disorders or those who had participated in another clinical trial with an active intervention or drug or device with the last dose taken within 60 days were also excluded from the trial. No concomitant medication was allowed during the study. However, if participants reported any clinical symptoms during the study, the study physician prescribed the appropriate medication, which was documented.
The primary endpoint of the study was the change in the number of weekly spontaneous bowel movements (SBM) from baseline to the end of the study. This was evaluated by the participants' self-reported number of spontaneous defecations per week.
The secondary endpoints were:
- Change in the subjective symptom scores (e.g., abdominal bloating, abdominal pain/discomfort, straining during passing of stool and feeling of incomplete evacuation) from baseline to end of the treatment using a predefined 4-point scale.
- Change in Subjective Global Assessment (SGA) scores from the day 7 to end of treatment to end of treatment using a predefined 5-point scale.
- Change in Physician Global Assessment (PGA) scores from the day 7 to end of treatment to end of treatment using a predefined 5-point scale.
- Change in general health symptoms, vital signs, hematology, renal function, liver function, serum lipids and urinalysis parameters from baseline to end of treatment.
The 30-day study duration consisted of 4 assessment points, including baseline (Visit 1, Day 0) and follow-ups
during Visit 2 (Day 7 ± 2), Visit 3 (Day 14 ± 2) and Visit 4 (End of the Study) at Day 30 ± 2. Patients underwent history and physical examination at all assessment points. They were also examined for SBM score and subjective symptom scores on 4-point scale. Laboratory investigations including liver function test, kidney function test, complete blood profile, serum lipids and urine analysis were performed at Visit 1 and Visit 4. SGA and PGA scores on 5-point scale were evaluated during follow-up visits. Concomitant medications and adverse events were also assessed.
Data were abstracted and presented as a number, percentage, mean and standard deviation (SD). All efficacy and safety variables were summarized using descriptive statistics. Data comparison between baseline and follow-up visits was performed using a paired t-test or one-way analysis of variance (ANOVA), as appropriate, and data were expressed as mean, SD, 95% confidence interval (CI) and p-value. A p value of 0.05 was considered statistically significant. Statistical analysis was done using statistical software SPSS 10.0.
RESULTS
A total of 30 subjects with a mean age of 45.63 ± 14.34 years (range 19-64 years) including 12 (40%) females and 18 (60.0%) males were recruited for the study. The demographic information of the participants is summarized in Table 1.
|
Table 1. Summary of Demographic Data of the Subjects (n = 30)
|
|
Parameters
|
Range
|
Number (%)
|
Mean
|
SD
|
|
Age (year)
|
1-64
|
-
|
45.63
|
14.34
|
|
Male
|
-
|
18 (60)
|
-
|
-
|
|
Female
|
-
|
12 (40)
|
-
|
-
|
|
Height (cm)
|
152-181
|
-
|
167.63
|
8.50
|
|
Weight (kg)
|
54.40-76.30
|
-
|
64.56
|
6.87
|
Assessment of Spontaneous Bowel Movements
SBM were assessed at days 7 (V2), 14 (V3) and 30 (V4) on the basis of the participants' self-reported number of spontaneous defecations per week using one-way ANOVA test. Results showed a significant increase in the mean of SBM per week from day 7 to days 14 and 30. Change in SBM score at day 30 was found to be statistically significant (p < 0.0001) compared to the day 7 (Table 2 and Fig. 1).
|
Table 2. Comparison of SBM Score at Visit 2 with Follow-up Visits 3 and 4 (n = 30)
|
|
Parameters
|
Visits (V)
|
Mean score
(mean ± SD)
|
Change from V1
(mean ± SD)
|
95% CI of Diff.
|
P value
|
|
SBM
|
V2
V3
V4
|
1.20 ± 0.41
1.47 ± 0.51
2.20 ± 0.76
|
-
–0.27 ± 0.52
–1.0 ± 0.74
|
-
–0.631 to 0.098
–1.364 to –0.636
|
<0.0001***
|
Level of significance ***P < 0.001.
*P < 0.05, **P < 0.01, ***P < 0.001.
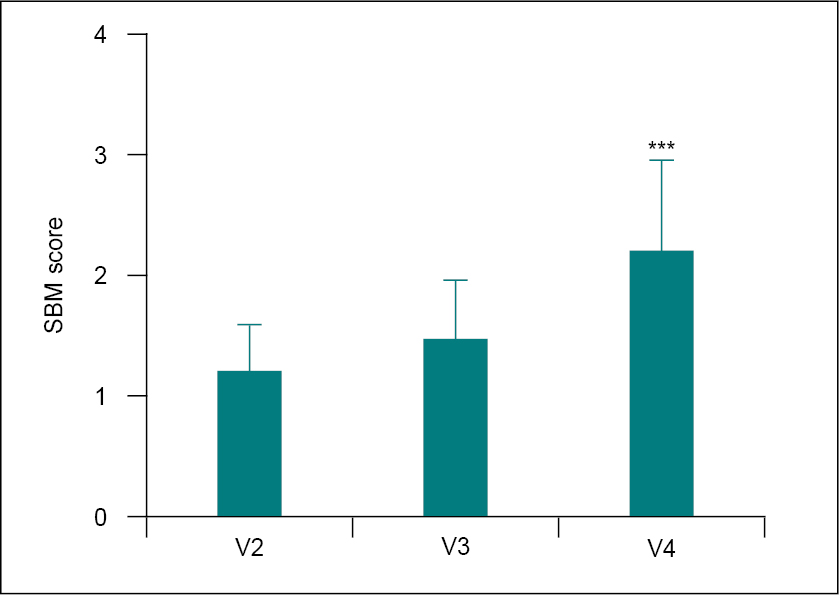
Figure 1. Comparison of SBM score at V2 with V3 and V4 using the one-way ANOVA test.
Level of significance ***P< 0.001.
*P < 0.05, **P < 0.01, ***P < 0.001.
Assessment of Constipation Symptoms
Constipation symptoms such as abdominal bloating (aadmana), abdominal pain/discomfort (aanaha), feeling of incomplete evacuation, and straining during passing stool were assessed on a 4-point scale at all assessment points. All constipation-related symptom scores were significantly (p < 0.0001) reduced at days 7, 14 and 30 compared to baseline (Table 3 and Fig. 2).
|
Table 3. Comparison of Mean Change in Symptom Scores from V1 to Different Follow-up Visits (n = 30)
|
|
Parameters
|
Visits (V)
|
Mean score (mean ± SD)
|
Change from V1 (mean ± SD)
|
95% CI of Diff.
|
P value
|
|
Abdominal bloating
|
V1
V2
V3
V4
|
2.03 ± 0.85
1.40 ± 0.77
0.93 ± 0.78
0.50 ± 0.63
|
-
0.63 ± 0.61
1.10 ± 0.84
1.53 ± 0.94
|
-
0.102-1.158
0.572-1.628
1.002-2.058
|
<0.0001***
|
|
Abdominal pain/discomfort
|
V1
V2
V3
V4
|
2.0 ± 0.95
1.27 ± 0.69
0.70 ± 0.60
0.37 ± 0.49
|
-
0.73 ± 0.91
1.30 ± 1.06
1.63 ± 1.07
|
-
0.243-1.217
0.813-1.787
1.143-2.117
|
<0.0001***
|
|
Feeling of incomplete evacuation
|
V1
V2
V3
V4
|
2.43 ± 0.50
1.50 ± 0.51
0.83 ± 0.59
0.23 ± 0.43
|
-
0.93 ± 0.69
1.60 ± 0.72
2.20 ± 0.66
|
-
0.576-1.284
1.246-1.954
1.846-2.554
|
<0.0001***
|
|
Straining during passing stool
|
V1
V2
V3
V4
|
2.40 ± 0.50
1.43 ± 0.63
0.87 ± 0.78
0.37 ± 0.49
|
-
0.97 ± 0.67
1.57 ± 0.82
2.03 ± 0.72
|
-
0.546-1.394
1.106-1.954
1.606-2.454
|
<0.0001***
|
|
Total score
|
V1
V2
V3
V4
|
8.87 ± 1.41
5.60 ± 1.40
3.30 ± 1.54
1.47 ± 1.14
|
-
3.27 ± 1.17
5.57 ± 1.68
7.40 ± 1.59
|
-
2.313-4.227
4.613- 6.527
6.443-8.357
|
<0.0001***
|
Comparison of V1 score versus different follow-up visits (V2, V3 and V4) was performed by one-way ANOVA test. Level of significance ***P < 0.001.
*P < 0.05, **P < 0.01, ***P < 0.001.

Figure 2. Comparison of mean change in symptom scores from V1 to different follow-up visits (n = 30).
Comparison of V1 score versus different follow-up visits (V2, V3 and V4) was performed by one-way ANOVA test. Level of significance ***P < 0.001.
*P < 0.05, **P < 0.01, ***P < 0.001.
The total constipation symptom score was also significantly reduced from 8.87 ± 1.41 (baseline) to 5.60 ± 1.40 at day 7, 3.30 ± 1.54 at day 14 and 1.47 ± 1.14 at day 30.
Assessment of SGA and PGA Scores
The SGA and PGA scores were evaluated on a 5-point scale on days 7, 14 and 30. When compared to day 7, both scores were significantly (p < 0.0001) lower on days 14 and 30 (Table 4 and Fig. 3). The SGA score decreased significantly from 2.30 ± 0.79 (day 7) to 1.30 ± 0.70 and 0.67 ± 0.66 at days 14 and 30, respectively. The PGA score was also significantly reduced from 1.80 ± 0.76 (day 7) to 1.0 ± 0.64 and 0.60 ± 0.50 at days 14 and 30, respectively.
|
Table 4. Comparison of Baseline SGA and PGA Scores with Different Follow-up Visits (n = 30)
|
|
Parameters
|
Visits (V)
|
Mean score (mean ± SD)
|
Change from V1 (mean ± SD)
|
95% CI of Diff.
|
P value
|
|
SGA
|
V2
V3
V4
|
2.30 ± 0.79
1.3 ± 0.70
0.67 ± 0.66
|
-
1.0 ± 0.69
1.63 ± 0.89
|
-
0.5454-1.455
1.179-2.088
|
<0.0001***
|
|
PGA
|
V2
V3
V4
|
1.80 ± 0.76
1.0 ± 0.64
0.60 ± 0.50
|
-
0.80 ± 0.66
1.20 ± 0.81
|
-
1.989-3.077
2.389-3.477
|
<0.0001***
|
Comparison of V2 versus V3 and V4 scores was performed by one-way ANOVA test.
Level of significance ***p < 0.001.
*P < 0.05, **P < 0.01, ***P < 0.001.

Figure 3. Comparison of V2 SGA and PGA scores with different follow-up visits (n = 30).
Comparison of V2 versus V3 and V4 scores was performed by one-way ANOVA test. Level of significance ***P < 0.001.
*P < 0.05, **P < 0.01, ***P < 0.001.
Safety Assessment
No treatment-related abnormalities were observed in the general appearance, eyes, ear, nose, throat, abdomen, heart and chest during all study visits. The baseline vital signs were also compared on days 7, 14 and 30. Changes in heart rate at days 14 and 30, systolic blood pressure (SBP) at day 30 and diastolic blood pressure (DBP) at days 7, 14 and 30 were found to be statistically significant; however, all the vital sign parameters were within normal range (Table 5 and Fig. 4).
|
Table 5. Comparison of Mean Change in Vital Signs from Baseline to Different Follow-up Visits (n = 30)
|
|
Parameters
|
Visits (V)
|
Mean score (mean ± SD)
|
Change from V1 (mean ± SD)
|
95% CI
of Diff.
|
P value
|
|
Heart rate (bpm)
|
V1
V2
V3
V4
|
62.0 ± 5.89
61.53 ± 4.31
68.70 ± 6.46
69.0 ± 5.34
|
-
0.47 ± 3.92
–6.70 ± 7.41
–7.0 ± 7.91
|
-
–0.9967 to 1.930
–9.468 to –3.932
–9.955 to –4.045
|
-
0.519
<0.0001***
<0.0001***
|
|
SBP (mm/Hg)
|
V1
V2
V3
V4
|
109.90 ± 5.42
111.50 ± 6.36
109.30 ± 6.49
106.5 ± 6.68
|
-
–1.53 ± 6.11
0.67 ± 5.52
3.40 ± 8.42
|
-
–3.815 to 0.749
–1.395 to 2.729
0.2569 to 6.543
|
-
0.18
0.514
0.035*
|
|
DBP (mm/Hg)
|
V1
V2
V3
V4
|
74.13 ± 2.69
75.87 ± 2.61
77.93 ± 1.39
77.90 ± 1.30
|
–1.73 ± 3.79
–3.80 ± 4.14
–3.77 ± 2.85
|
–3.147 to –0.320
–4.974 to –2.626
–4.830 to –2.703
|
0.018*
<0.0001***
<0.0001***
|
Statistical analyses were performed using paired t-test. Comparison: V1 versus V2, V3 and V4, where level of significance *P< 0.05 and ***P< 0.001.
*P < 0.05, **P < 0.01, ***P < 0.001.
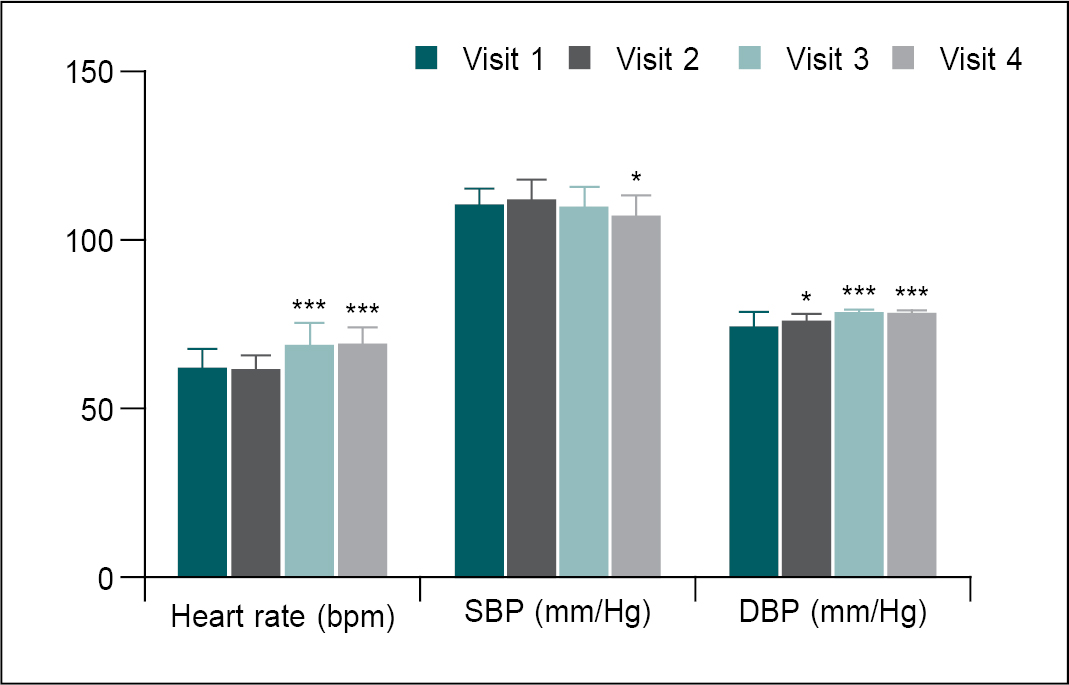
Figure 4. Comparison of mean change in vital sign parameters at different visits.
Statistical analysis was performed using paired t-test. Comparisons: V1 versus V2, V3 and V4, where level of significance *P< 0.05 and ***P< 0.001.
*P < 0.05, **P < 0.01, ***P < 0.001.
No significant differences in complete blood count (CBC) parameters were noted between baseline and day 30, and all values were within the normal range (Table 6 and Fig. 5).
|
Table 6. Comparison of Mean Change in Blood Parameters from V1 to V4 (n = 30)
|
|
Parameters
|
Visits (V)
|
Mean score (mean ± SD)
|
Change from V1 (mean ± SD)
|
95% CI of Diff.
|
P value
|
|
RBC (million/cu mm)
|
V1
V4
|
5.15 ± 0.08
5.25 ± 0.08
|
-
–0.1 ± 0.20
|
-
–0.171 to –0.021
|
-
0.014*
|
|
Hb (g/dL)
|
V1
V4
|
14.60 ± 1.04
14.67 ± 0.98
|
-
–0.07 ± 0.31
|
-
–0.180 to 0.049
|
-
0.249
|
|
WBC (10^9/L)
|
V1
V4
|
8.53 ± 1.31
8.70 ± 1.22
|
-
–0.17 ± 0.59
|
-
–0.391 to 0.047
|
-
0.120
|
|
Neutrophils (%)
|
V1
V4
|
53.13 ± 2.58
54.61 ± 2.81
|
-
–1.48 ± 4.15
|
-
–3.027 to 0.069
|
-
0.060
|
|
Lymphocytes (%)
|
V1
V4
|
37.08 ± 1.94
35.92 ± 2.42
|
-
1.16 ± 3.44
|
-
–0.125 to 2.443
|
-
0.075
|
|
Monocytes (%)
|
V1
V4
|
5.58 ± 1.79
5.54 ± 1.46
|
-
0.040 ± 1.62
|
-
–0.565 to 0.645
|
-
0.893
|
|
Eosinophils (%)
|
V1
V4
|
3.45 ± 1.44
3.23 ± 1.61
|
-
0.22 ± 1.98
|
-
–0.516 to 0.963
|
-
0.542
|
|
Basophils (%)
|
V1
V4
|
0.76 ± 0.19
0.71 ± 0.17
|
-
0.06 ± 0.29
|
-
–0.053 to 0.166
|
-
0.299
|
|
Platelet count
(x1000/cu mm)
|
V1
V4
|
344.0 ± 30.63
340.5 ± 23.58
|
-
4.367 ± 4.37
|
-
–4.201 to 12.93
|
-
0.306
|
|
ESR (mm 1st hour)
|
V1
V4
|
10.77 ± 3.66
10.53 ± 2.95
|
-
0.23 ± 4.22
|
-
–1.341 to 1.807
|
-
0.764
|
Statistical analysis was performed using paired t-test. Comparisons: V1 versus V4, where level of significance *P < 0.05.
*P < 0.05, **P < 0.01, ***P < 0.001.
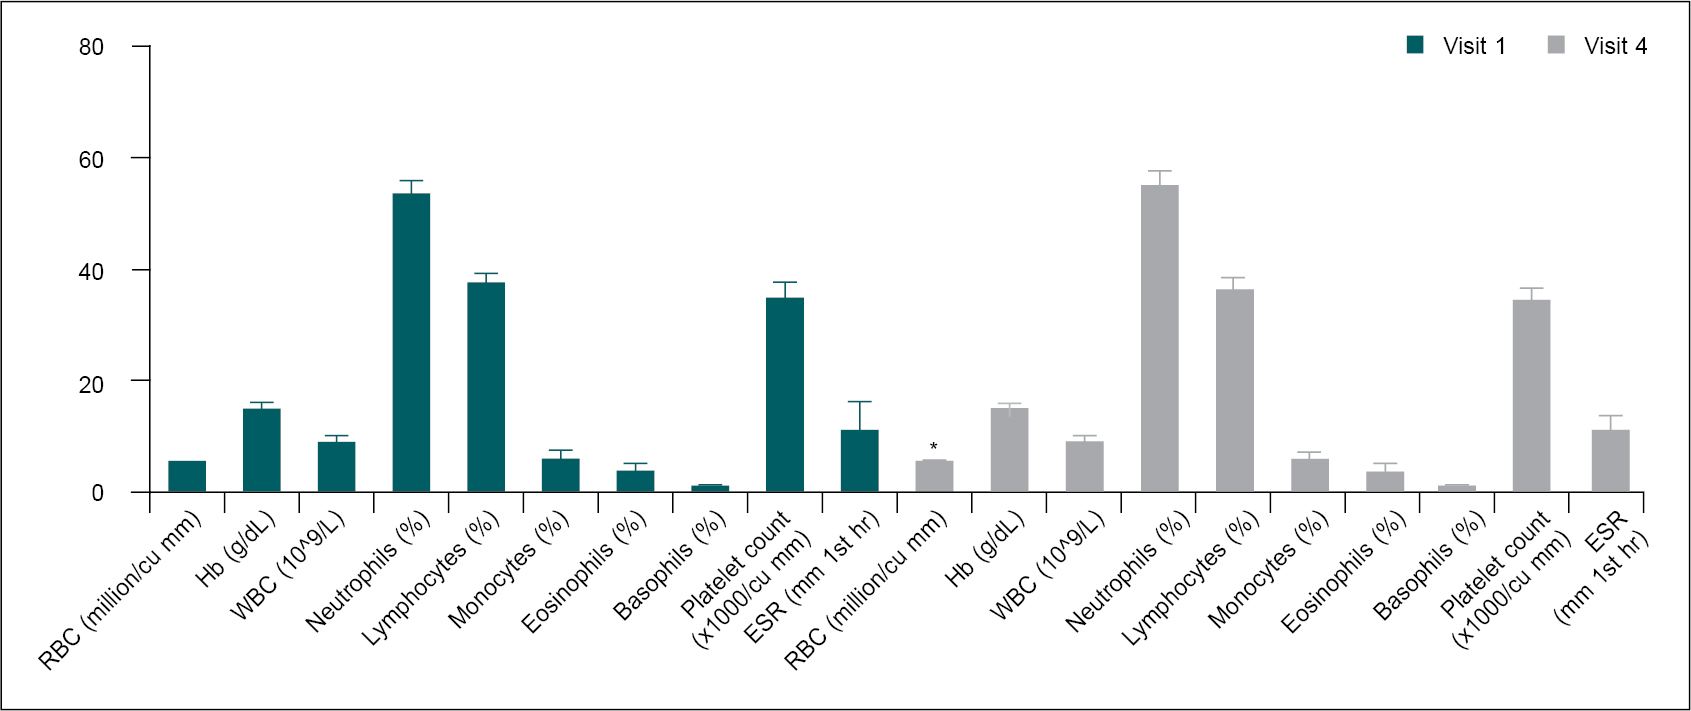
Figure 5. Comparison of mean change in blood parameters at different visits.
Statistical analysis was performed using paired t-test. Comparisons: V1 versus V4, where level of significance *P< 0.05.
*P < 0.05, **P < 0.01, ***P < 0.001.
The serum levels of blood urea nitrogen (BUN) and creatinine were in the normal range at both assessment points, but the reduction in serum creatinine level at day 30 was statistically significant (p < 0.05) (Table 7 and Fig. 6).
|
Table 7. Comparison of Mean Change in BUN and Serum Creatinine from V1 to V4 (n = 30)
|
|
Parameters
|
Visits (V)
|
Mean score (mean ± SD)
|
Change from V1 (mean ± SD)
|
95% CI of Diff.
|
P value
|
|
BUN
(mg/dL)
|
V1
V4
|
15.05 ± 4.37
14.51 ± 4.25
|
-
0.54 ± 6.65
|
-
–1.945 to 3.023
|
-
0.661
|
|
Serum creatinine (mg/dL)
|
V1
V4
|
0.94 ± 0.157
0.93 ± 0.925
|
-
0.01 ± 0.28
|
-
–0.095 to 0.117
|
-
0.829
|
Statistical analysis was performed using paired t-test. Comparisons: V1 versus V4.
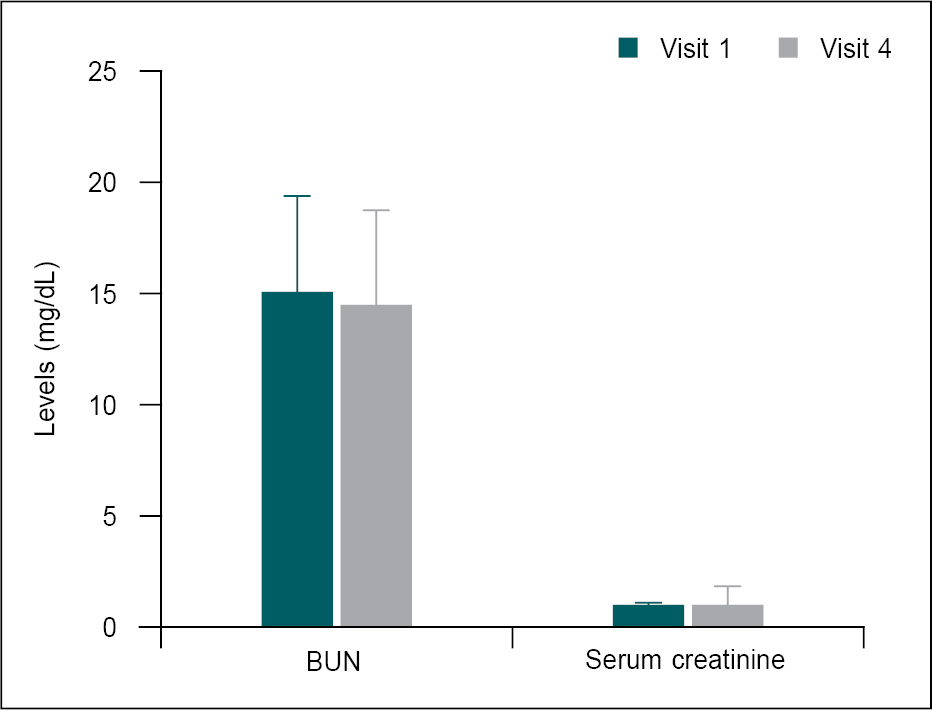
Figure 6. Comparison of mean change in kidney function test parameters at different visits.
Compared V1 kidney function parameters with V4 using paired t-test.
The serum lipids parameters were not remarkably changed at day 30 when compared to baseline and all serum lipid parameters were within the normal range (Table 8 and Fig. 7).
|
Table 8. Comparison of Mean Change in Lipid Parameters from V1 to V4 (n = 30)
|
|
Parameters
|
Visits (V)
|
Mean score
(mean ± SD)
|
Change from V1
(mean ± SD)
|
95% CI of Diff.
|
P value
|
|
Total cholesterol (mg/dL)
|
V1
V4
|
151.7 ± 13.98
156.1 ± 13.27
|
-
–4.47 ± 18.46
|
-
–11.36 to 2.425
|
-
0.195
|
|
TG (mg/dL)
|
V1
V4
|
123.9 ± 12.73
116.1 ± 14.17
|
-
7.80 ± 17.72
|
-
1.184 to 14.42
|
-
0.023*
|
|
HDL cholesterol (mg/dL)
|
V1
V4
|
73.77 ± 7.94
73.97 ± 6.09
|
-
–0.20 ± 10.98
|
-
–4.301 to 3.901
|
-
0.921
|
|
LDL cholesterol (mg/dL)
|
V1
V4
|
83.33 ± 7.64
81.83 ± 9.83
|
-
1.50 ± 11.88
|
-
–2.937 to 5.937
|
-
0.495
|
|
VLDL cholesterol (mg/dL)
|
V1
V4
|
20.83 ± 4.25
18.93 ± 5.09
|
-
1.90 ± 7.02
|
-
–0.721 to 4.521
|
-
0.149
|
|
Chol:HDL ratio
(mg/dL)
|
V1
V4
|
2.07 ± 0.25
2.13 ± 0.29
|
-
–0.06 ± 0.42
|
-
–0.213 to 0.103
|
-
0.482
|
Statistical analysis was performed using paired t-test. Comparisons: V1 versus V4, where level of significance *P < 0.05.
*P < 0.05, **P < 0.01, ***P < 0.001.
TG = Triglyceride; HDL = High-density lipoprotein; LDL = Low-density lipoprotein; VLDL = Very-low-density lipoprotein.
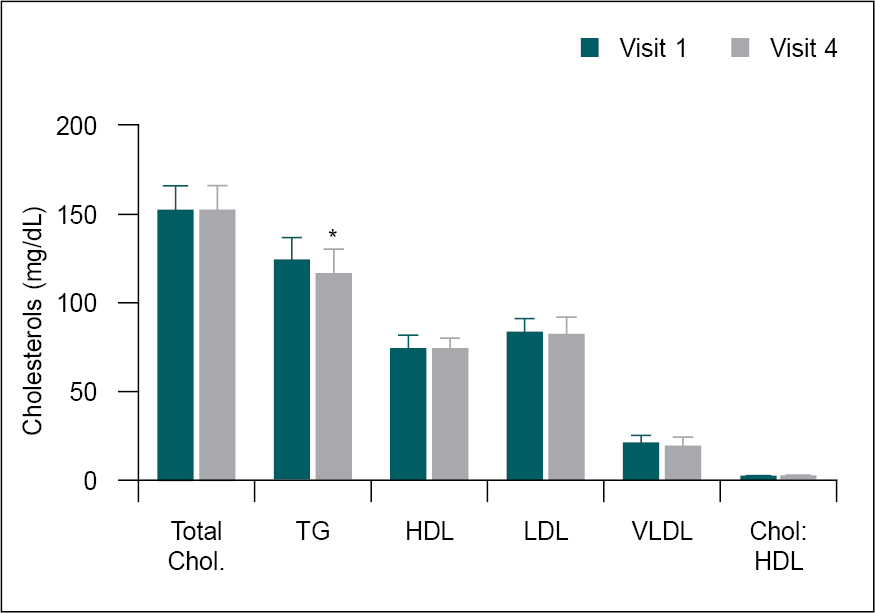
Figure 7. Comparison of mean change in serum cholesterol levels from V1 to V4.
Statistical analysis was performed using paired t-test. Comparisons: V1 versus V4, where level of significance *P < 0.05.
*P < 0.05, **P < 0.01, ***P < 0.001.
The liver function parameters including serum levels of serum glutamic-oxaloacetic transaminase (SGOT) and serum glutamic-pyruvic transaminase (SGPT) as well as total bilirubin were not remarkably changed at day 30 when compared to baseline and all liver function parameters were within the normal range (Table 9 and Fig. 8).
|
Table 9. Comparison of Mean Change in Liver Function Parameters from V1 to V4 (n = 30)
|
|
Parameters
|
Visits (V)
|
Mean score (mean ± SD)
|
Change from V1 (mean ± SD)
|
95% CI of Diff.
|
P value (V1 vs. V4)
|
|
SGOT (IU/L)
|
V1
V4
|
27.20 ± 7.54
26.02 ± 12.82
|
-
1.18 ± 13.76
|
-
–3.960 to 6.316
|
-
0.643
|
|
SGPT (IU/L)
|
V1
V4
|
34.60 ± 14.45
31.96 ± 14.60
|
-
2.64 ± 19.02
|
-
–4.463 to 9.737
|
-
0.454
|
|
Total bilirubin (mg/dL)
|
V1
V4
|
0.81 ± 0.22
0.56 ± 0.28
|
-
0.23 ± 0.35
|
-
0.114 to 0.392
|
-
0.0013**
|
Statistical analysis was performed using paired t-test. Comparisons: V1 versus V4, where level of significance **P < 0.01.
*P < 0.05, **P < 0.01, ***P < 0.001.
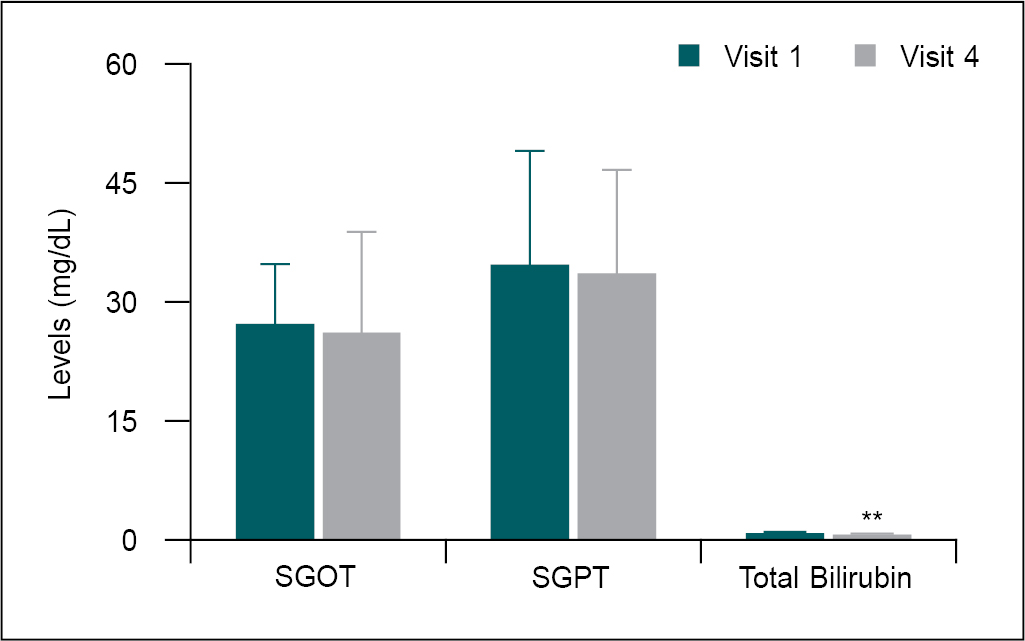
Figure 8. Comparison of mean change in liver function parameters from V1 to V4.
Statistical analysis was performed using paired t-test. Comparisons: V1 versus V4, where level of significance **p < 0.01.
*P < 0.05, **P < 0.01, ***P < 0.001.
Urinalysis parameters showed no significant difference between two evaluation points: baseline and day 30.
No adverse effects or serious adverse effects were observed during the study period. However, one participant at visit 3 and one participant at visit 4 had diarrhea; however, this effect was found to be unrelated to "Anuloma DS" treatment.
REVIEW OF LITERATURE
- lanceolata or Senna has been used as a laxative and purgative. The laxative property of Senna is attributed to anthraquinone glycosides called sennosides - Sennoside A and sennoside B.5 By stimulating intestinal peristalsis, it causes rapid expulsion of feces. Senna also increases secretion of fluids by the colon causing softening of stool so that it can easily pass through the intestine.6
- chebula or Haritaki, has traditionally been prescribed to improve gastrointestinal motility and it has relieved constipation.7 The aqueous extract of T. chebula seeds caused a dose-dependent increase in the frequency of rat ileum motility and tension of contraction. The fecal number and fecal water content also increased dose-dependently. These results support the use of T. chebula for the treatment of constipation.8 Its prokinetic activity has been demonstrated in an experimental study where it significantly increased gastric emptying.9 Due to its prokinetic activity, it increases intestinal peristalsis. T. chebula enhances the process of digestion, regulates colon function and stimulates absorption of nutrients.10 The purgative action of an oil obtained from T. chebula has been demonstrated in a study.11,12 In a short-term clinical trial, T. chebula helped in complete evacuation of the bowel in patients suffering from constipation.12,13
Also known as Liquorice, G. glabra has mild laxative activity and through its demulcent action, it can protect the intestinal lining by increasing mucus production.14 Glycyrrhizin, a phytoactive constituent of G. glabra, has anti-inflammatory activity.15 An essential oil obtained from the fruit of C. cyminum has antiparasitic, appetizing, digestive and carminative properties.16 By enhancing intestinal peristalsis, cumin can relieve bloating and dyspepsia and thus facilitate excretion of waste material from the stomach and intestines.17 In a pilot study of patients with irritable bowel syndrome (IBS), a significant reduction in abdominal pain, bloating, incomplete defecation, fecal urgency was noted following the use of cumin extract. Stool consistency improved as did the frequency of bowel movement in patients with constipation-predominant IBS.16
- officinale or Ginger has several bioactive compounds mainly gingerols, zingerone, gingerenone-A and 6-dehydrogingerdione, zingiberene and β-sesquiphellandrene among others. By increasing the muscular activity in the gastrointestinal tract, these active constituents increase stimulate digestion, absorption, relieve constipation and flatulence.18,19 Dry ginger powder is oily. It lubricates the inner wall of the intestine, especially the large intestine and facilitates elimination of feces. It also breaks down the hard feces in the colon so that the stool becomes soft and can be easily excreted.20 A. leptophyllum is called “Ajmoda” in Hindi. It is antispasmodic in nature and has been used to cure stomach aches and diarrhea because of its powerful antibacterial, antifungal and anti-inflammatory properties.21 All types of salts have been described as having appetizing, digestive stimulant and laxative activities.22 Halite, commonly known as Rock salt or Saindhava lavana is considered best among all salts and according to Ayurveda should be used daily. It enhances healthy metabolism and helps in the process of digestion. Salt is carminative, improves appetite and alleviates heartburn. Hence, it is prescribed for digestive disorders and as a laxative.23
CONCLUSION
The results of the present clinical study demonstrated that Anuloma DS is highly effective for the treatment of chronic functional constipation, as evidenced by the increased in SBM score, and decrease constipation symptoms as well as SGA and PGA scores through the synergistic therapeutic actions of its constituent herbs. Furthermore, during the 30-day treatment period, no significant changes in vital signs, hematological profile, lipid profile, renal and liver functions, or urinalysis parameters were observed. There were no treatment-related side effects reported by any of the study participants.
REFERENCES
- Peppas G, Alexiou VG, Mourtzoukou E, Falagas ME. Epidemiology of constipation in Europe and Oceania: a systematic review. BMC Gastroenterol. 2008;8:5.
- Marshall JB. Chronic constipation in adults. How far should evaluation and treatment go? Postgrad Med. 1990; 88(3):49-51, 54, 57-9, 63.
- Rao SS. Constipation: evaluation and treatment. Gastroenterol Clin North Am. 2003;32(2):659-83.
- Johnson DA. Treating chronic constipation: how should we interpret the recommendations? Clin Drug Investig. 2006;26(10):547-57.
- Upadhyay A, Chandel Y, Nayak PS, Khan NA. Sennoside contents in Senna (Cassia angustifolia ) as influenced by date of leaf picking, packaging material and storage period. J Stored Prod Postharvest Res. 2011;2(5):97-103.
- Khan MSA. A review on Senna: an excellent prophetic herbal medicine. WJPMR. 2020;6(7):113-8.
- Hassan Bulbul MR, Uddin Chowdhury MN, Naima TA, Sami SA, Imtiaj MS, Huda N, et al. A comprehensive review on the diverse pharmacological perspectives of Terminalia chebula Heliyon. 2022;8(8):e10220.
- Mard SA, Veisi A, Naseri MK, Mikaili P. Spasmogenic activity of the seed of Terminalia chebula Retz in rat small intestine: in vivo and in vitro studies. Malays J Med Sci. 2011;18(3):18-26.
- Tamhane MD, Thorat SP, Rege NN, Dahanukar SA. Effect of oral administration of Terminalia chebula on gastric emptying: an experimental study. J Postgrad Med. 1997;43(1):12-3.
- Kolla JN, Kulkarni NM, Kura RR, Theepireddy SKR. Terminalia chebula – an important medicinal plant. Herba Polonica. 2017;63(4):45-56.
- Miglani BD, Sen P, Sanyal PK. Purgative action of an oil obtained from Terminalia chebula. Indian J Med Res. 1971;59(2):281-3.
- Chattopadhyay RR, Bhattacharyya SK. Terminalia chebula: an update. Phcog Rev. 2007;1(1):151-6.
- Tripathi VN, Tiwari SK, Gupta JP, Chaturvedi GN. Clinical trial of Haritaki (Terminalia chebula) in treatment of simple constipation. Sachittar Ayur. 1983;35(11):733-40.
- Murray MT. Glycyrrhiza glabra (Licorice). Textbook of Natural Medicine. 2020:641-647.e3.
- Shah SL, Wahid F, Khan N, Farooq U, Shah AJ, Tareen S, et al. Inhibitory effects of Glycyrrhiza glabra and its major constituent glycyrrhizin on inflammation-associated corneal neovascularization. Evid Based Complement Alternat Med. 2018;2018:8438101.
- Agah S, Taleb AM, Moeini R, Gorji N, Nikbakht H. Cumin extract for symptom control in patients with irritable bowel syndrome: a case series. Middle East J Dig Dis. 2013;5(4):217-22.
- Niaki MT, Atarod Z, Omidvar S, Zafari M, Aghamohammadi A, Asadi T, et al. Comparing the effects of cumin, peppermint, and milk of magnesia on gastrointestinal complications after caesarean section. Glob J Health Sci. 2016;8(12):78-86.
- Mao QQ, Xu XY, Cao SY, Gan RY, Corke H, Beta T, et al. Bioactive compounds and bioactivities of Ginger (Zingiber officinale Roscoe). Foods. 2019;8(6):185.
- Zadeh JB, Kor NM. Physiological and pharmaceutical effects of Ginger (Zingiber officinale Roscoe) as a valuable medicinal plant. Euro J Exp Bio. 2014;4(1):87-90.
- Sandeep S. Commentary on therapeutic role of ginger (Zingiber officinale) as medicine for the whole world. Int J Pharmacogn Chinese Med. 2017;1(1):000102.
- Sheikh TA, Ganie SY, Reshi MS. Phytochemistry, pharmacological properties and medicinal uses of Apium leptophyllum: a review. Pharmacogn Rev. 2023;17(33):135-43.
- Mooss NS. Salt in ayurveda I. Anc Sci Life. 1987;6(4):217-37.
- Sarker A, Ghosh A, Sarker K, Basu D, Sen DJ. Halite; the rock salt: enormous health benefits. World J Pharm Res. 2016;5(12):407-16.